For the past few weeks I’ve been working on the problem of Cycle-Induced Forest Fires, which I’ve referred to in passing in some recent posts. The aim has been to find a non-contrived process which exhibits self-organised criticality, that is, where the process displays critical characteristics (scaling laws, multiple components at the largest order of magnitude) forever. Note that this is in contrast to the conventional Erdos-Renyi graph process, which is only critical at a single time n/2.
The conjecture is that the largest component in equilibrium typically has size on a scale of n^2/3. An argument based on the equilibrium proportion of isolated vertices gives an upper bound on this exponent. The working argument I have for the lower bound at the moment can comfortably fit on the back of a napkin, with perhaps some context provided verbally. Of course, the current full text is very much larger than that, mainly because the napkin would feature assertions like “event A happens at time 
“With high probability as 


It’s got to the point where I’ve exhausted the canonical set of symbols for small quantities: 
This has been a very long way of setting up what was going to be my main point, which is that at many points during undergraduate mathematics, colleagues (and occasionally to be honest, probably myself too) have complained that they “don’t want to have anything to do with analysis. They just want to focus on algebra / number theory / statistics / fluids…” Anyway, the point of this ramble was that I think I’ve realised that it is very hard to think about any sort of open problem without engaging with the sort of ideas that a few years ago I would have thought of (and possibly dismissed) as ‘analysis’.
Much of my working on this problem has been rather from first principles, so haven’t been thinking much about any neat less elementary theory recently.
Ok, so on with the actual post now.
Last month I talked about local limits of graphs, which describe convergence in distribution of (local) neighbourhood structure about a ‘typical’ vertex. This is the correct context in which to make claims like “components of 

Even from this example, we can see a couple of drawbacks and omissions from this limiting picture. In the sub-critical regime, this G-W tree will be almost surely finite, but the number of vertices in the graph is going to infinity. More concretely, the limit description only tells us about a single component. If we wanted to know about a second component, in this case, it would be roughly independent of the size of the first component, and with the same distribution, but if we wanted to know about all components, it would get much more complicated.
Similarly, this local limit description isn’t particularly satisfactory in the supercritical regime. When the component in question is finite, this description is correct, but with high probability we have a giant component, and so the ‘typical’ vertex is with some positive probability in the giant component. This is reflected by the fact that the G-W tree with supercritical offspring distribution is infinite with some positive probability. However, the giant component does not look like a 
This is all unsurprising. By definition a local limit describes the structure near some vertex. How near? Well, finitely near. It can be arbitrarily large, but still finite, so in particular, the change in the offspring distribution after O(n) vertices as mentioned above will not be covered.
So, if we want to learn more about the global structure of a large discrete object, we need to consider a different type of limit. In particular, the limit will not necessarily be a graph. Rather than try to define a priori a ‘continuum’ version of a graph, it is sensible to generalise from the idea that a graph is a discrete object and instead consider it as a metric space.
In this article, I don’t want to spend much time at all thinking about how to encode a finite graph as a metric space. We have a natural notion of graph distance between vertices, and it is not hard to extend this to points on edges. Alternatively, for sparse graphs, we have an encoding through various functions, which live in some (metric) function space.
However, in general, the graph will be a metric object itself, rather than necessarily a subset of a global metric space. We will be interested in convergence, so we need a suitable style of convergence of different metric spaces.
The natural candidate for this is the Gromov-Hausdorff metric, and the corresponding Gromov-Hausdorff convergence.
The Hausdorff distance between two subsets X, Y of a metric space is defined as follows. Informally, we say that 

It is not particularly illuminating to prove that this is in fact a metric. In fact, it isn’t a metric as the definition stands, but rather a pseudo-metric, which is exactly the same, only allowing d(X,Y)=0 when X and Y are not equal. Note that

for any set X, so this gives an example, provided X is not both open and closed. Furthermore, if the underlying metric space is unbounded, then the Hausdorff distance between two sets might be infinite. For example in 
We can overcome this pair of objections by restricting attention to closed, bounded sets. In practice, many spaces under consideration will be real in flavour, so it makes sense to define this for compact sets when appropriate.
But this still leaves the underlying problem, which is how to define a distance function on metric spaces. If two metric spaces X and Y were both subspaces of some larger metric space then it would be easy, as we now have the Hausdorff distance. So this is in fact how we proceed in general. We don’t need any knowledge of this covering space a priori, we can just choose the one which minimises the resulting Hausdorff distance. That is

where the infimum is taken over all metric spaces (E,d), and isometric embeddings 
The first observation is that this will again be a pseudometric unless we demand that X, Y be closed and bounded. The second is that this index set is not a set. Fortunately, this is quickly rectified. Instead consider all metrics on the disjoint union of sets X and Y, which is set, and contains the subset of those metrics which restrict to the correct metric on each of X and Y. It can be checked that this forms a true metric on the set of compact metric spaces up to isometry.
We have an alternative characterisation. Given compact sets X and Y, a correspondence between X and Y is a set of pairs in 


Then

In particular, this gives another reason why we don’t have to worry about taking an infimum over a proper class.
Gromov-Hausdorff convergence then has the natural definition. Note that this does not respect topological equivalence, ie homeomorphism. For example,

where the latter has the trivial metric. In particular, although all the closed balls are homeomorphic, the G-H limit is not.
A final remark is that the trees we might be looking at are not necessarily compact, so it is useful to have a notion of how this might be extended to non-compact spaces. The answer is to borrow the idea from local limits of considering large finite balls around a fixed central point. In the case of trees, this is particularly well-motivated, as it is often quite natural to have a canonical choice for the ‘root’.
Then with identified points 


REFERENCES
This article was based on some lecture notes by Jean-Francois Le Gall from the Clay Institute Summer School which can be found on the author’s website here (about halfway down the page). This material is in chapter 3. I also used Nicolas Curien’s tutorials on this chapter to inform some of the examples. The resolution of the proper class problem was mentioned by several sources I examined. These notes by Jan Christina were among the best.
Related articles
- Graph matching & Levenshtein distance (p1) (alikhuram.wordpress.com)
- Visibility of unrectifiable planar sets (ilaba.wordpress.com)
- Littlewood’s Three Principles (shinyetemon.wordpress.com)
- Almost all continuous functions are nowhere differentiable (chiasme.wordpress.com)
- Definability of Truth in Probabilistic Logic (qmaurmann.wordpress.com)
- Cantor-Bendixson rank in topology: Sierpinski-Mazurkiewicz theorem (chiasme.wordpress.com)
 is
is  . If these are natural numbers, we have a quick proof by induction using integration by parts, otherwise a slightly longer but still elementary argument gives the normalising constant as
 and is clear how we might generalise this.
 is a random variable supported on the subset of
  with
with  with density
  . For similar reasons, the correct normalising constant in the general case is
 has density:
 as gamma distributions with parameters
  , then we can specify
  as the Dirichlet distribution with these parameters by:
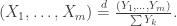
 for some fixed
  .
.


 balls of each of m colours. Obviously, this is going to turn into a proof by suggestive notation. In fact, the model doesn’t really rely on the
  being positive integers. Everything carries through with
  if we view the vector as the initial distribution.
 balls of colour i. The probability of this is:
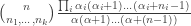
 . Then for large n, assuming for now that the
  we have
![\frac{\alpha(\alpha+1)\ldots(\alpha+n-1)}{n!}=\frac{[\alpha_i+(n_i-1)]!}{n_i! (\alpha_i-1)!}\approx \frac{n_i^{\alpha_i-1}}{(\alpha_i-1)!}.](https://s0.wp.com/latex.php?latex=%5Cfrac%7B%5Calpha%28%5Calpha%2B1%29%5Cldots%28%5Calpha%2Bn-1%29%7D%7Bn%21%7D%3D%5Cfrac%7B%5B%5Calpha_i%2B%28n_i-1%29%5D%21%7D%7Bn_i%21+%28%5Calpha_i-1%29%21%7D%5Capprox+%5Cfrac%7Bn_i%5E%7B%5Calpha_i-1%7D%7D%7B%28%5Calpha_i-1%29%21%7D.&bg=ffffff&fg=333333&s=0&c=20201002)

 as telegraphed by our choice of notation. With some suitable martingale machinery, you can also prove that this convergence happens almost surely, for a suitable limit RV defined on the tail sigma algebra.
